Go's New `slog`: A High-Performance Structured Logger for Observability
2025-09-12
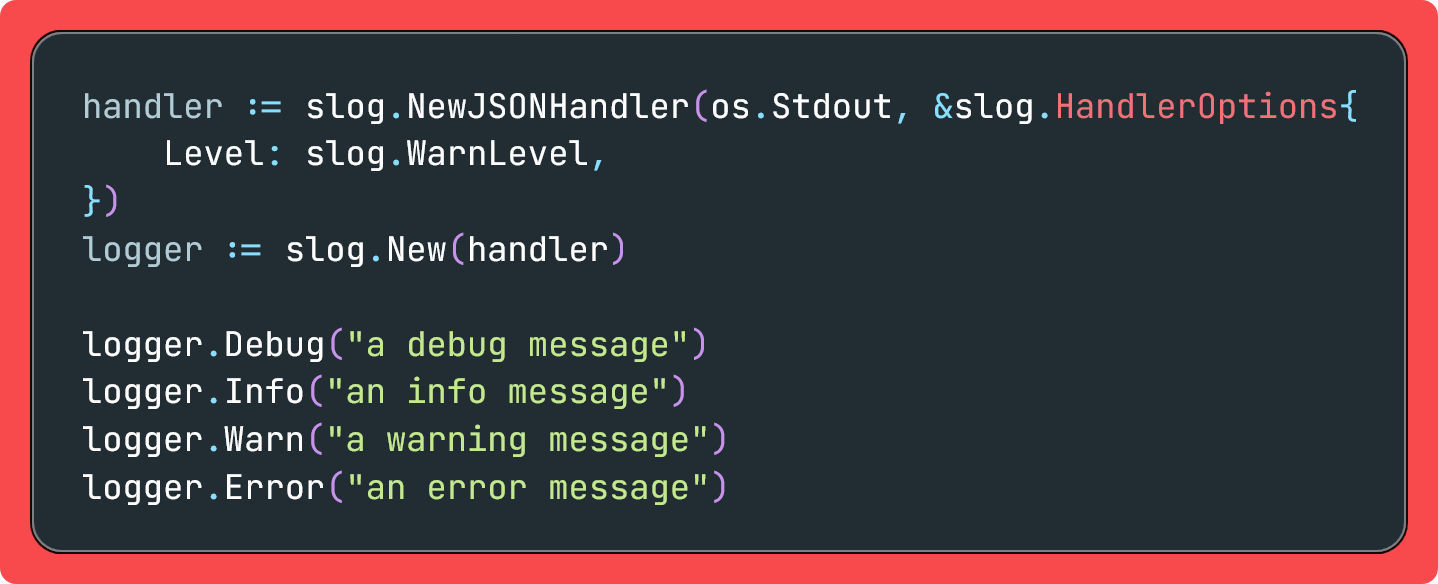
Go 1.21 introduces `slog`, a native, high-performance, structured logging solution designed to be the new standard. Built around `Logger`, `Handler`, and `Record`, `slog` offers a flexible and efficient logging approach. The article details `slog` usage, covering log levels, context-aware logging, attribute handling, level control, and custom handler creation, emphasizing the use of `slog.Attr` to prevent malformed log entries. Performance considerations, OpenTelemetry integration for enhanced observability, and best practices like global loggers and dependency injection are also discussed. `slog` aims to transform logging from an afterthought to a crucial observability signal.
Read more
Development
structured logging