Beyond KPIs: Revolutionizing Data Visualization with Dimensional Relationships
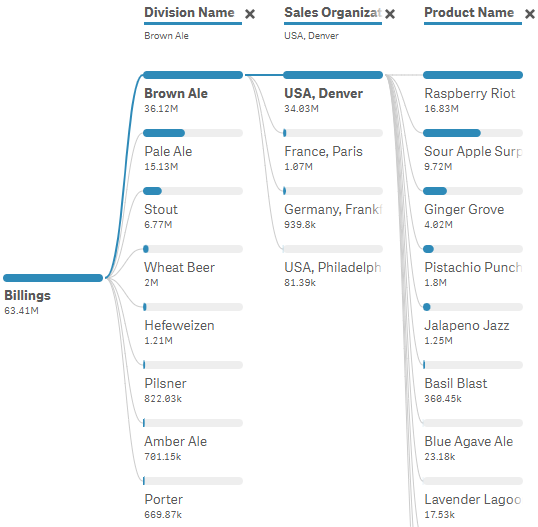
This article champions the importance of visualizing dimensional relationships in data. The author critiques the limitations of relying solely on KPIs, arguing they fail to reveal the underlying drivers of data. Sankey diagrams and Decomposition Trees are presented as superior alternatives for visualizing these relationships. Sankey diagrams offer a clear visual representation of proportions between dimensions, while Decomposition Trees provide a more detailed view of all values and allow for interactive exploration of dimensional impacts on key measures. Using the fictional Dorkweiser brewing company, the author illustrates the advantages of these methods, ultimately stressing that the goal of data visualization is to empower users to make data-driven decisions, not merely create aesthetically pleasing visuals.